

This publication has spent four issues pricing China’s humanoid stack. We valued a robot maker on its margin, tore down what that margin was funding, followed the profit into the supply chain, and argued that the data bottleneck resolves into a deployment question.
Every one of those arguments held the same variable fixed, and said so at the time. Unitree’s revenue growth was never in doubt, only its margin. The sensitivity grid put revenue on the x-axis precisely because we were not forecasting it. Leader Harmonious Drive’s roughly 570 times trailing earnings was priced on humanoid units that have not shipped. The data curve’s slope was a fleet size.
Holding a variable exogenous is a legitimate move, and it is honest as long as you eventually come back for it. This is coming back for it.
Four issues, one load-bearing assumption, taken as given each time. This is the issue that stops taking it as given.
The number the whole sector is priced on cannot survive being looked up
Start with what should be the easiest question in the industry. How many humanoid robots did China ship in 2025?
The answers, all from 2026 industry reports and all reported as fact:
14,400 units
18,000 units
about 20,000 units
28,000 units
That is a spread of nearly two to one on the most basic figure in the sector. It gets worse. One set of reports puts global 2025 shipments at about 17,000 units, with China holding 84.7 percent of them. Multiply those together and you get 14,399, which is where the lowest number comes from. But other reports put China alone at 20,000 to 28,000, which is more than the entire world is supposed to have shipped.
The Chinese figure exceeds the global figure. Both cannot be true, and both are in circulation.
This is not a rounding disagreement. It is evidence that the industry has no shared definition of what it is counting. Does a unit ship when it leaves the factory, when it is invoiced, when it is delivered, when it is installed? Does a research platform sold to a university count the same as an industrial unit installed on a line? Does a robot leased to a rental platform count once, or every time it is redeployed? Different answers to those questions produce every number on that list, and each report is internally honest while the set of them is incoherent.
Anyone building a valuation on this number is building on sand and calling it granite. The honest move is not to pretend the sand is granite, and it is not to refuse to build. It is to go and look at what the sand is made of. So let us look at the one dataset that is actually granular enough to interrogate.
The demand curve has the shape of a fiscal year
China discloses public tenders. According to the 2025-2026 industry report published by the Humanoid Robot Scenario Application Alliance in March 2026, disclosed humanoid procurement awards in 2025 numbered 292 projects worth more than 1.81 billion yuan. An independent tally by a Chinese financial outlet, working from the same public tender disclosures through September 2025, arrived at a compatible picture: roughly 600 million yuan of awards covering more than 1,000 robot units across 20-plus manufacturers. Two separate counts, same source material, same shape.
That is not the whole market, and neither source claims it is. Procurement does not have to go through tender, so these awards understate total demand. But this is the part with its receipts published, and its structure is the most honest picture available of who is actually buying.
Look first at how the awards are sized.
Projects under 1 million yuan: 54 percent of all awards
Projects between 1 and 10 million yuan: 33 percent
Projects over 10 million yuan: 10 in total
Projects over 100 million yuan: 4 in total
Eighty-seven percent of every disclosed award in the country came in under 10 million yuan. The alliance report puts education and research institutions at 66 percent of the 292 projects by count, and notes without apparent discomfort that this price band matches the budgets of university teaching platforms and small-scale training systems. The independent tally reaches the same conclusion from the other direction: most tender projects originate with universities and research institutes, the robots are bought as research tools, and a typical order is one or two units.
These are not production lines buying labor. These are laboratories buying a robot.
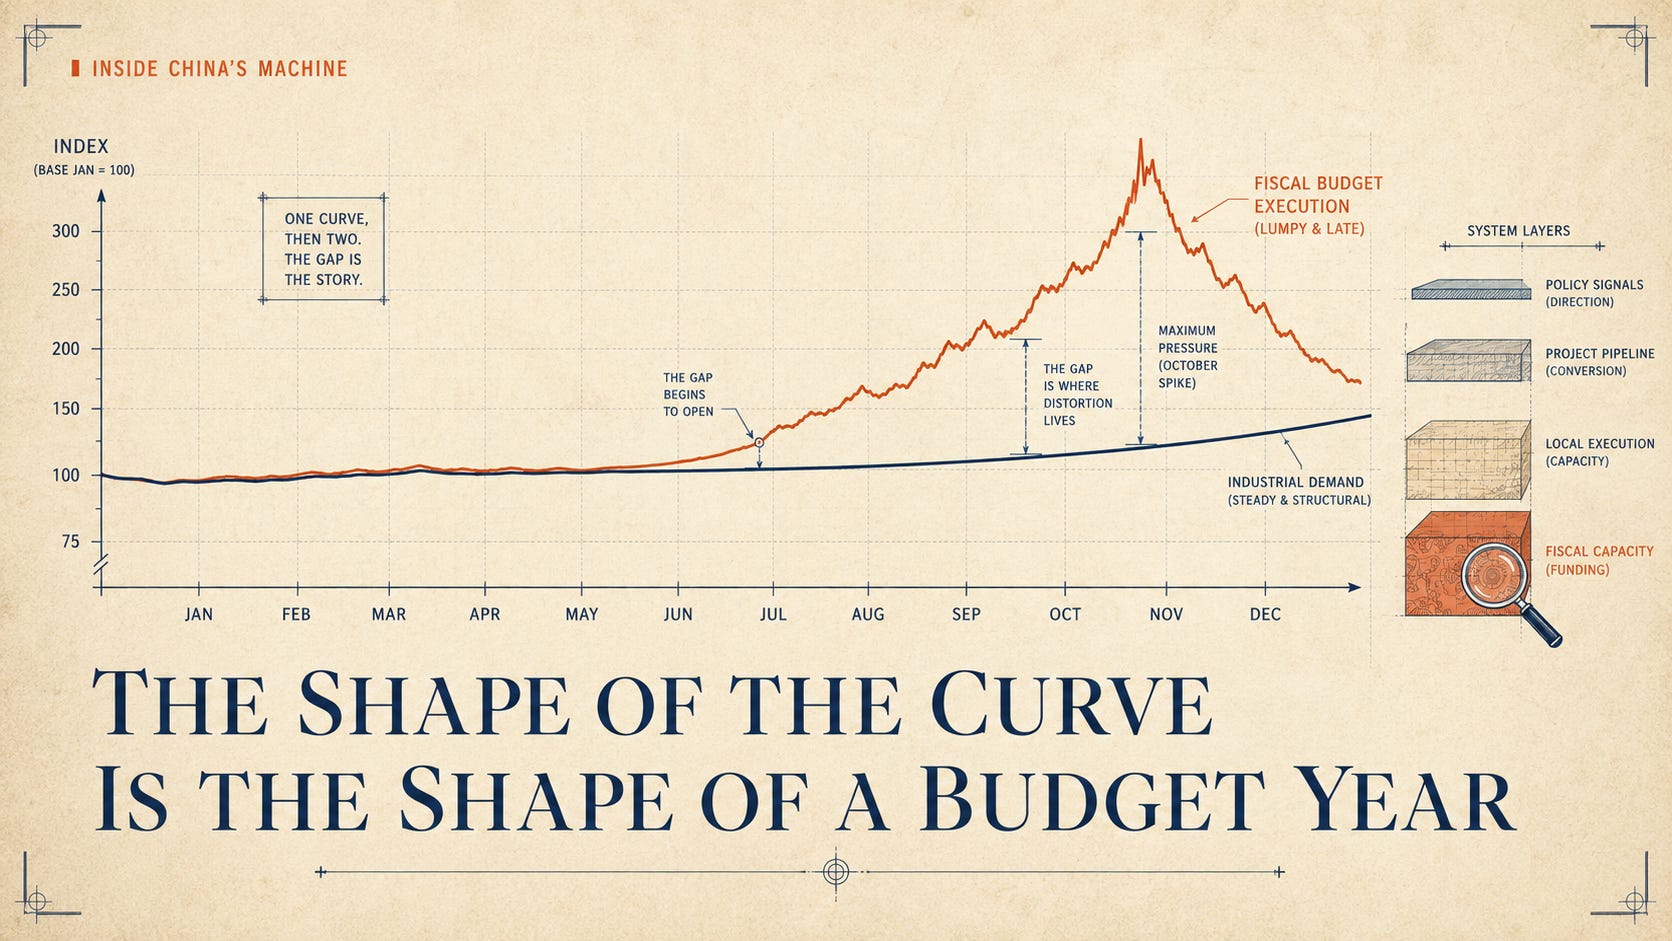
Now look at when the awards landed. In January and February the count declined. Through the second quarter it oscillated between roughly 15 and 23 projects a month with no sustained rise. Then, from July through December, it held above 27 projects a month for six consecutive months, peaking in October at 42.
The industry’s own analysis of this pattern is blunter than anything I would have written. It concludes that local fiscal budgets and university budgets run on concentrated execution cycles, and that those cycles have a decisive influence on the tender rhythm. In other words: the curve rises in the second half because that is when the money has to be spent, not because that is when the demand appeared.
A demand curve does not have that shape. A budget-execution calendar does.
The largest orders come from the balance sheet of a local government
The four awards above 100 million yuan are the ones that lift the total, and it is worth asking who wrote them.
They came from local state-owned investment platforms, industrial investment companies, and municipal construction entities, in cities including Fangchenggang, Zigong, Jiujiang, Liuzhou, and Zhumadian. These are not the manufacturing centers a Western reader would expect to lead a robotics rollout. And the awards, by the industry’s own description, are not primarily for teaching or research. They fund robot industrial parks, intelligent demonstration zones, and regional application-scenario construction.
That is a specific and recognizable thing. It is the local government industrial-policy playbook, the same structure that built solar, batteries, and electric vehicles, applied to humanoids. A local platform company borrows against future land and tax revenue, buys the assets that qualify the city as a designated industrial base, and books the deployment.
I want to be careful here, because the lazy version of this observation is that the demand is fake. It is not fake. Solar was built this way and it now dominates the world. Batteries were built this way and CATL is real. Chinese industrial policy has a track record of converting subsidized demand into genuine global competitiveness, and betting against it has been a losing trade for two decades.
But subsidized volume and market volume have different risk properties, and they must be discounted differently. Market demand persists as long as the buyer earns a return. Policy demand persists as long as the fiscal cycle funds it. One is underwritten by a customer’s profit and loss, the other by a municipality’s balance sheet, and the local government financing vehicles doing this buying are operating under the most sustained deleveraging pressure they have faced in years.
The market is currently discounting both at the same rate. That is the mispricing.
What survives the audit, and what does not
Honesty requires saying clearly what this does not prove, because there is real industrial deployment underneath the noise and it is growing.
UBTech delivered more than 500 industrial humanoids in 2025 against production capacity above 1,000 units, brought its thousandth Walker S2 off the line, and reported an order book approaching 1.4 billion yuan, with Walker unit costs down about 25 percent from 2024. Note the distinction that most coverage blurs: an order book is a promise, and deliveries are the fact. UBTech’s own numbers show the promise running roughly three times ahead of the delivery, and the company posted a loss of 439 million yuan in the first half of 2025 while carrying that book. Galbot has agreed to deploy over 1,000 embodied robots with a manufacturing partner and its ecosystem. One research report puts 65 percent of Chinese humanoid shipments into factory settings. Whatever the tender data says about the tail, the head of this market contains real industrial customers buying real robots for real work.
So the finding is not that the demand is hollow. It is narrower and more useful than that:
The market has two demand curves stacked on top of each other and reports them as one number. Underneath is a genuine, growing, slow industrial curve, where a factory buys a robot because it pays for itself. On top of it is a fast, lumpy, fiscally-timed curve, where a laboratory or a municipal platform buys a robot because a budget exists. They have different growth rates, different durability, and different sensitivity to a downturn. Blending them into a single shipment figure, and then pricing a supply chain off that figure, is how a sector talks itself into a multiple.
The industry’s own segmentation says exactly this, for anyone willing to read it. The alliance report breaks 2025 demand into five scenarios. Education and research buys the most units but in ones and twos at low prices. Data collection is bought by government and state-asset bases, in batches of a hundred or more. Interactive service goes to corporate showrooms, museums, and tourism venues. Entertainment and performance goes to rental and event companies, at high volume and low unit price. And industrial logistics, the one scenario where a robot is bought to do work that pays for it, is described by the alliance itself as still small in scale because humanoids remain at a preliminary stage.
Read that list again. The scenario that justifies the valuations is the one the industry says is smallest.
There is a detail here that closes a loop from our last issue. UBTech’s final award of 2025, worth 59.6 million yuan, was to build a humanoid robot data-collection center in Huizhou’s Huiyang district. We argued last issue that embodied AI is bottlenecked by data and that data comes from deployment. Here is what that looks like in practice in China: a municipal government writing a check for a facility whose output is training data. The physical machine and the institutional machine are not adjacent. They are the same transaction.
And the industry knows. A venture investor quoted in the Chinese press observes that most domestic humanoids remain in demonstration and performance roles, running preset motions, and that this reveals the brain is not merely immature but arguably not yet formed. A widely read Chinese tech outlet notes that a machine costing hundreds of thousands of yuan is still valued by many buyers for what it calls emotional value rather than productivity. Chinese analysts have begun asking openly whether the sector’s order book contains related-party volume of the sort that once inflated the electric vehicle industry.
None of that appears in the shipment number. All of it is in the shipment number.
Two of our own conclusions have to be revised
Letting a variable move changes what depends on it. Two of the conclusions in earlier issues were conditional on the volume assumption, and now that the assumption has structure, those conclusions need recalibrating.
Issue three argued that Leader Harmonious Drive has a floor under it, because its harmonic reducers still sell into industrial robots and machine tools even if humanoids disappoint. That still holds. But the humanoid growth on top of that floor is now partly identified as fiscally-timed procurement, which means the incremental volume driving a roughly 570 times multiple has a different persistence profile than the industrial base underneath it. The floor is real. The thing being priced above the floor is softer than it looked.
Issue four argued that the data bottleneck resolves into a deployment function, because trajectories come from robots doing real work. That argument survives, but it acquires a filter. A robot in a university lab generates a trajectory. A robot in a demonstration zone generates a photograph. If 87 percent of disclosed awards are laboratory-scale, then a large share of China’s deployed fleet is not generating the industrial manipulation data that the fleet-size arithmetic assumed. The 100,000-robot fleet that collapses 212 years into two only does so if the robots are working. Robots that are exhibiting produce nothing an embodied model can learn from.
The deployment layer, in other words, is not just a destination or even a data source. It is the audit function for every layer above it. What actually happens on the floor is the only thing that can validate the numbers being priced at the top.
Read the receipts, not the forecast
The stack has a bottom and a top, and this publication has argued that the value lives in the seams between them. This issue argues something narrower and more uncomfortable. The seams are only as trustworthy as the measurement at the bottom, and the measurement at the bottom is currently a number that four different research houses cannot agree on, whose seasonality tracks a budget calendar, and whose largest line items are written by the investment arms of prefecture-level cities.
That is not a reason to be bearish on Chinese humanoids. It is a reason to price the two demand curves separately, and to treat any valuation built on a blended shipment figure as a valuation built on a number that has not yet been defined.
The forecasts for 2026 run from 62,500 units to 200,000. Before believing any of them, it is worth asking a question the forecasts never answer. When those robots ship, who signs the check, and what do they do with the robot on Monday morning.
Inside China’s Machine is research, not investment advice. Tender counts, award-size distribution, monthly seasonality, scenario segmentation, and the identity of the largest procuring entities are drawn from the 2025-2026 industry report published by the Humanoid Robot Scenario Application Alliance in March 2026, and are cross-checked against an independent tally of the same public tender disclosures. Both are compilations of public procurement records rather than primary filings, and are labeled accordingly. Shipment totals are Estimated and are reported here precisely because they conflict. Company delivery figures for UBTech and Galbot are Confirmed from company announcements. Views on demonstration-versus-productive use are Estimated and attributed to named industry participants. Forward volumes are Projected. Current as of July 11, 2026.
What interests me most is that the unreliable shipment numbers may still reveal something important.
They may not measure commercial adoption so much as how widely China has distributed an unfinished technology across universities, municipal programs, research centers, and industrial sites.
That process is wasteful, but it also spreads the work of finding where the technology fails and what must be solved next. The numbers may be describing not just the market, but China’s development method.