



Inside China’s Machine · Tokenomics, Episode 1 of 10
Anthropic keeps a documentation page on optimizing for cost and intelligence. In the middle of it sits a result that should unsettle anyone who reads AI economics off a price list.
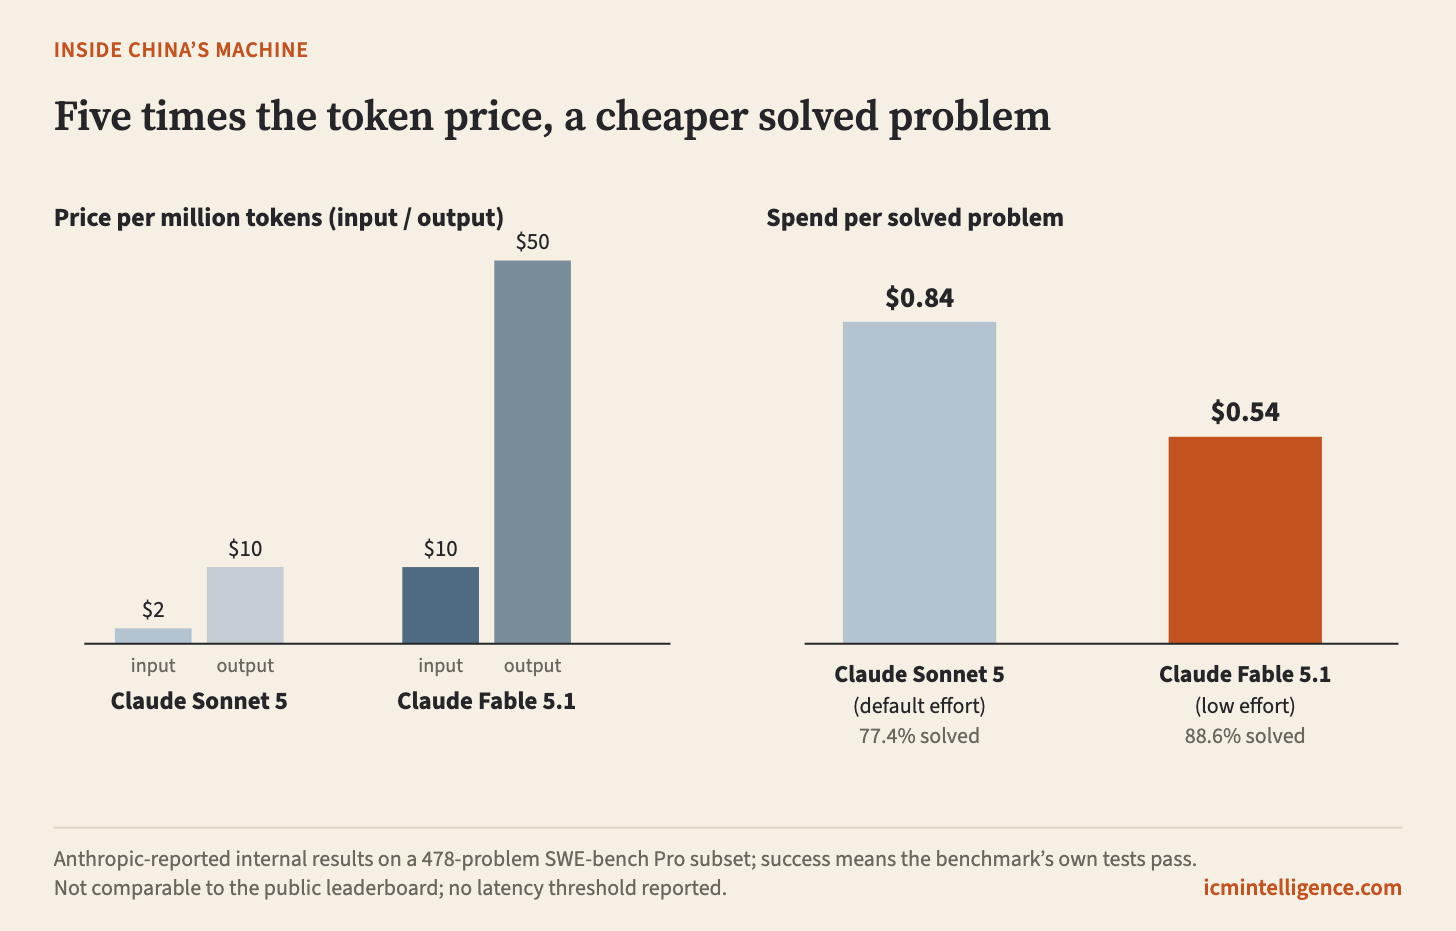
Anthropic reports results for two of its models on 478 problems from SWE-bench Pro, a coding benchmark in which a model has to resolve an issue in a real repository and succeeds only if the benchmark’s own tests pass. Claude Sonnet 5, at its default effort setting, solved 77.4 percent of them. Claude Fable 5.1, at its low effort setting, solved 88.6 percent.
Fable’s tokens are the expensive ones. Anthropic lists Sonnet 5 at $2 per million input tokens and $10 per million output tokens. Fable 5.1 lists at $10 and $50: five times the price on both sides of the meter.
Per solved problem, the order flips. Fable cost $0.54. Sonnet cost $0.84.
The expensive meter produced the cheaper answer.
That single comparison matters because it breaks a tempting assumption: that the token is the unit of the product. If the token were the unit, the economics would be simple: cheaper tokens would mean cheaper intelligence, and a token price war would be the whole story. A buyer would pick the lowest price per million, an investor would chart the falling price per million, and both would be reading the right number.
They would be reading the meter. What a buyer wants is the answer, and the price of the answer moves with more than the price of the meter.
The simplest case
Start with the smallest version of the problem: one task, attempted many times, with a test that says yes or no.
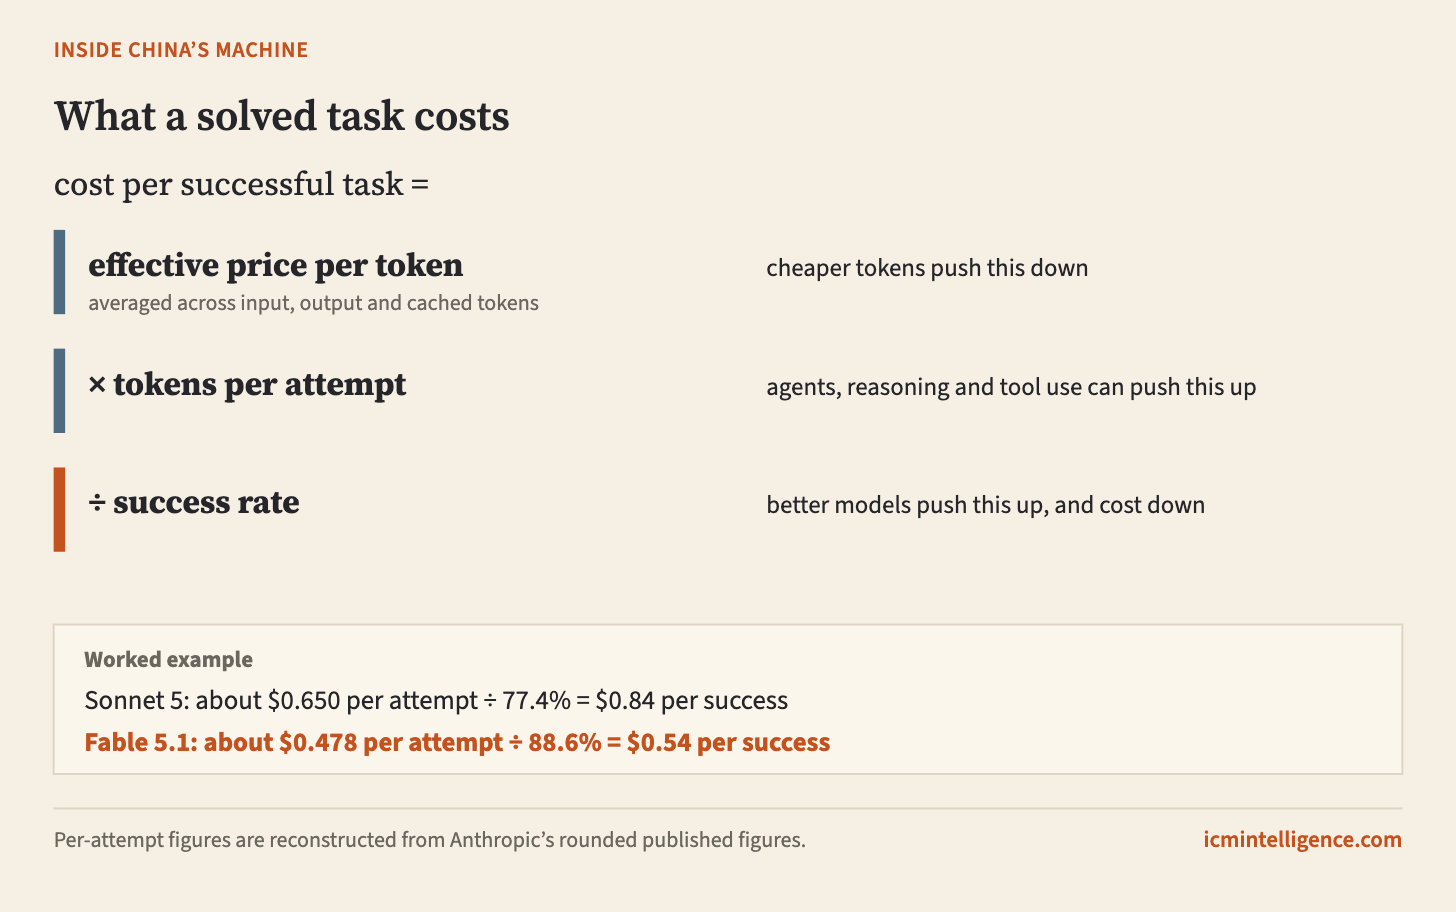
Two numbers describe it. The first is what an attempt costs: tokens in, tokens out, each at its rate. The second is how often an attempt succeeds. The cost of one success is the first divided by the second. If an attempt costs a dollar and half of attempts succeed, each success costs two dollars.
Anthropic’s figures can be run backwards through that identity. At $0.84 per solved problem and a 77.4 percent success rate, Sonnet 5 spent about $0.650 per attempt on average. At $0.54 and 88.6 percent, Fable 5.1 spent about $0.478 per attempt. These are reconstructions from the published, rounded figures, not invoices, but they show where the reversal comes from.
Fable did not only succeed more often. Its reconstructed bill per attempt was lower too, while its base rates were five times higher. Anthropic does not publish the mix of input, output and cached tokens behind those bills, so the reconstruction stops at spend.
Two measured factors were at work, then, and both favored Fable: each attempt cost less, and each attempt was more likely to succeed. Both pushed the cost of a solved problem down. Those gains held despite Fable’s higher base token prices.
This is the distinction the rest of the series rests on. A token is a meter on work done. The economic unit is a successful task: a defined piece of work, checked against a test fixed in advance. The cost of that unit depends on the price of the meter, on how much metered work an attempt consumes, and on how often an attempt passes.
Each of the three can move without the others.
What the comparison shows, and what it does not
A number that reverses intuition deserves the same scrutiny as one that confirms it. Every comparison of task costs has to say what was held fixed, and here the list is short.
The workload is fixed, as Anthropic describes it: a 478-problem subset of one coding benchmark. Its notes also mention an original 482-problem subset, so whether the older Sonnet runs used exactly the same problems as the Fable run is not fully clear. The success test is fixed: the benchmark’s own tests. The cost boundary, what the bill counts, is a token bill, priced at customer rates. Anthropic calls the run “Anthropic-internal” and warns that its scores are “not comparable to the public leaderboard.”
Other things are not fixed. No latency threshold is reported for the pair, so nothing here says Fable is cheaper at an equal speed. The two results were not measured side by side in one sitting either: Anthropic’s notes pair a single Fable run from August 21, 2026 with pooled Sonnet runs from its earlier measurement series. And a token bill is not the cost of putting a coding model into production. Engineers who review the patches, security checks and integration work sit outside any token bill.
So the comparison supports one claim and refuses several others. It shows, on one workload, that token price does not settle the cost of a solved task. It does not rank the two models, does not say the same order holds for research, customer support or agents, and does not measure what a company pays to ship software.
That is enough. The claim being tested is that the token is a sufficient unit. One clean counterexample on a real workload is what it takes to reject it.
What replaces it is the measure this series calls the Intelligence Cost Curve: the commercial spend per successful task, stated with its workload, its success test, its latency and reliability treatment, its cost boundary and the date it was measured. Strip any of those away and the number stops meaning anything. Keep them and any two ways of getting the work done, such as two models or two effort settings, can be compared honestly, even when their tokens are priced, counted and consumed differently.
A price table is not a ranking
The opposite error is to rank models by price tables. It is easy to make, because price tables look like comparisons.
Take one fixed bill of work, chosen only for illustration: 100,000 input tokens and 10,000 output tokens. Price it at each provider’s published rates.
At OpenAI’s promotional rates for GPT-5.6 Sol, $4 per million input tokens and $20 per million output, the bill comes to $0.60. OpenAI says the promotional pricing runs at least through November 21, 2026. At Anthropic’s rates for Sonnet 5, it comes to $0.30. At DeepSeek’s rates for V4.1 Flash, it comes to between $0.042 and $0.0063, depending on the time of day and whether the input hits DeepSeek’s cache.
Sixty cents at one end, under one cent at the other, for the same count of tokens.
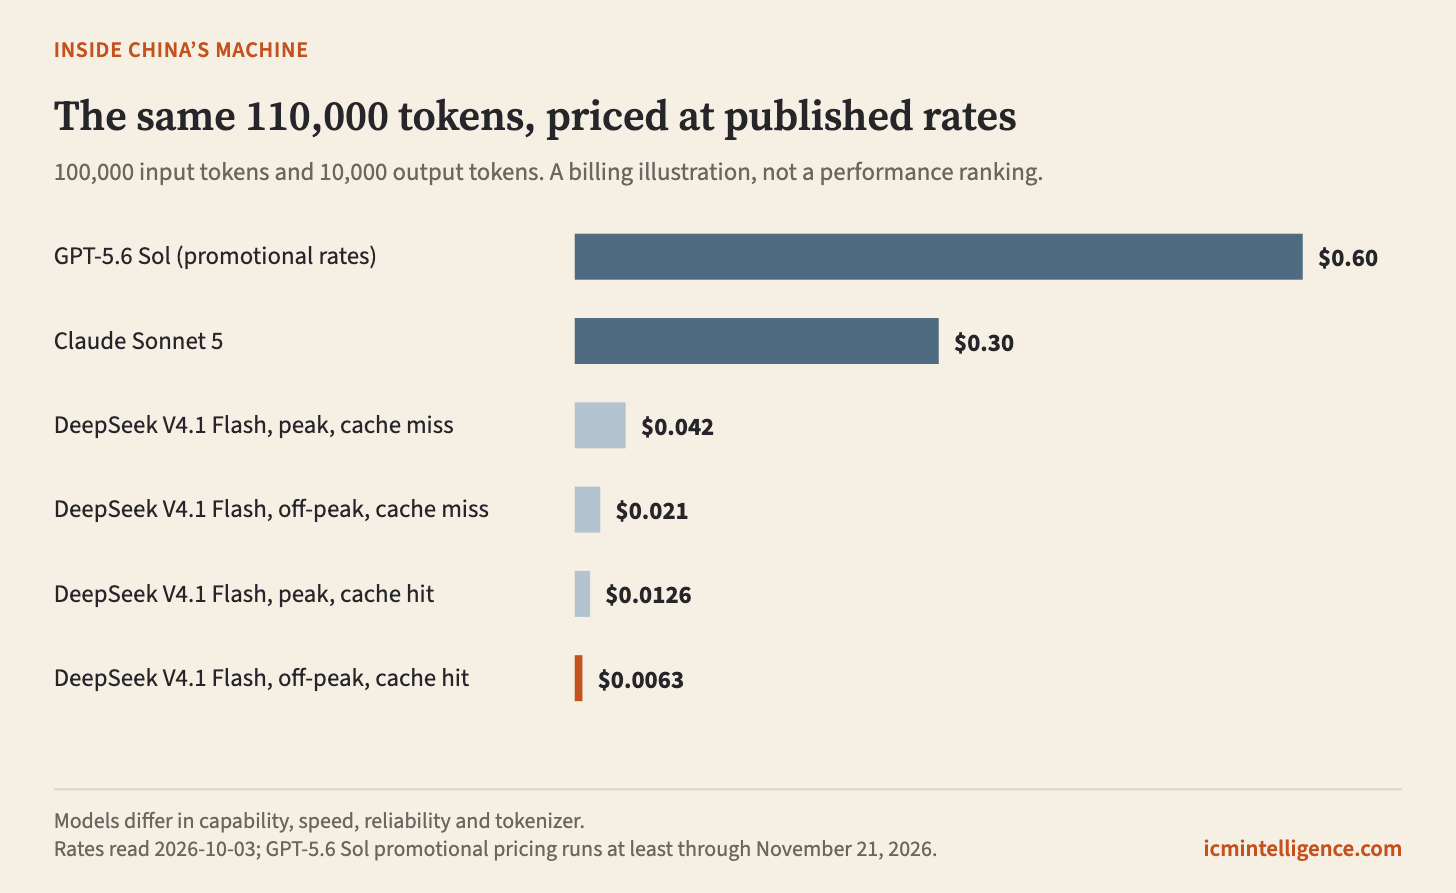
The table says nothing about which bill buys the right answer. The models differ in capability, speed, reliability and in how they reason. They also count differently. Anthropic’s own guidance for Sonnet 5 says it “uses a new tokenizer that produces approximately 30% more tokens for the same text” than Claude Sonnet 4.6. The same paragraph of English is a different number of tokens on different models, so a fixed token count is not even a fixed piece of text, let alone a fixed piece of work.
Even inside a single provider, the billed price depends on how the customer builds the request. GPT-5.6 Sol charges $0.40 per million for cached input, a tenth of its standard input rate. Sonnet 5 charges $0.20 per million for cache reads, and its batch interface takes 50 percent off input and output. Two companies calling the same model can face very different effective prices, with no change to the model at all.
What a price table measures is the billing system. That is useful to know. It is not a measure of intelligence.
The schedule that makes the meter visible
DeepSeek’s price schedule shows the gap between meter and answer more plainly than any other, and it is worth reading in the original.
The Chinese-language pricing page lists DeepSeek-V4.1-Flash in yuan per million tokens. Input that misses the cache costs 2元 during peak hours and 1元 off-peak. Input that hits the cache costs 0.04元 at peak and 0.02元 off-peak. Output costs 8元 at peak and 4元 off-peak. The English page gives the same structure in dollars: $0.30 and $0.15 for a cache miss, $0.006 and $0.003 for a cache hit, $1.20 and $0.60 for output.
Every off-peak rate is exactly half its peak rate. And between the most expensive input class and the cheapest, peak with a cache miss against off-peak with a cache hit, the price differs by a factor of 100, in either currency.
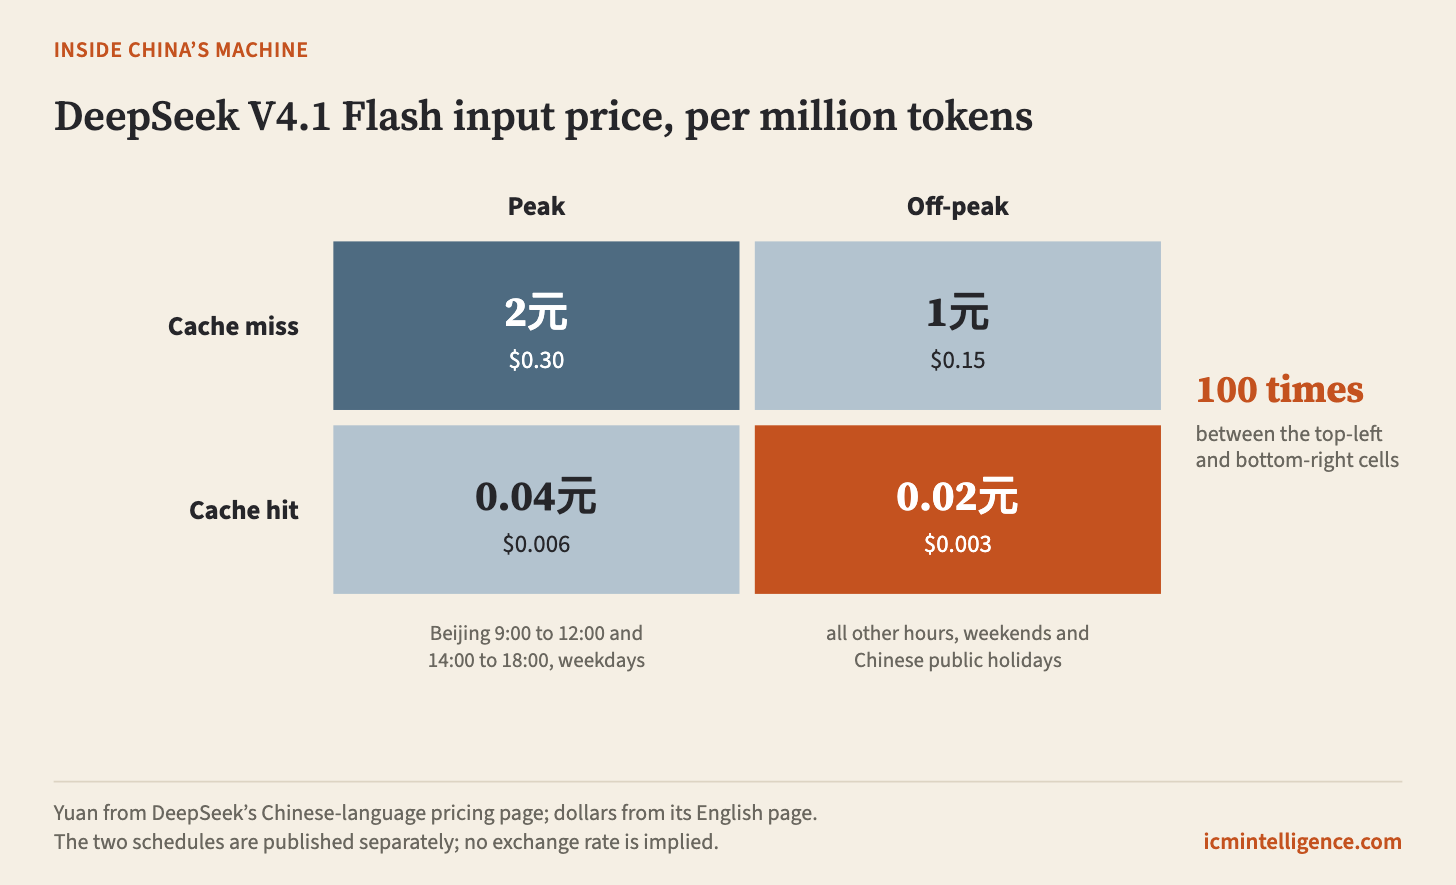
The Chinese page defines peak as 9:00 to 12:00 and 14:00 to 18:00, Beijing time, Monday to Friday, “不含中国法定节假日”: excluding China’s statutory public holidays. Weekends are off-peak in full. Peak, in other words, is the Beijing working day. Converted to UTC, the windows run from 01:00 to 04:00 and from 06:00 to 10:00; all other hours are off-peak.
Read as an economic mechanism, the schedule does two things. It prices DeepSeek’s capacity by the clock, charging more during Beijing’s working hours. And it hands the buyer a set of levers that change the bill without changing the model: run work when Beijing is asleep, and structure prompts so that repeated input hits the cache. Off-peak cache-hit input is priced at a hundredth of peak cache-miss input, for the same model.
DeepSeek’s schedule shows that a Chinese provider’s prices are low and highly segmented. It shows that the route a buyer takes, meaning the provider, the model, and how and when the work is sent, can move the billed price of a token by two orders of magnitude before quality enters at all. It does not show that DeepSeek’s routes deliver cheaper successful tasks than anyone else’s at matched quality, speed and reliability. No measurement here compares a Chinese route with a non-Chinese one on a fixed task, and without one the honest position is in between: the prices are real and the pressure they exert on the meter is real; whether they are also cheaper answers is a separate question that needs a separate test.
The meter can run faster
OpenRouter reports that agentic requests on its platform use “about 15x more per request, according to OpenRouter data,” than human-driven ones: an agent that plans, calls tools and checks its own work bills far more tokens per request than a person asking a question. That figure counts tokens per request, not per task, and describes one platform’s traffic, not a universal multiplier. It is still enough to show the direction of travel. As work shifts from a person typing a prompt to a system running a loop, the tokens behind each task can rise.
More tokens are not waste by default. Charlie Snell, Jaehoon Lee, Kelvin Xu and Aviral Kumar, in a paper at ICLR 2025, studied what happens when a model is allowed more computation at the moment of answering. Allocated well, extra test-time computation improved efficiency by “more than 4x” against a best-of-N baseline in their math-reasoning setting. In some cases matched on total computation, a smaller model given more thinking outperformed “a 14x larger model”, though only where the smaller model already had a reasonable chance of success. How much the extra thinking helped depended on how hard the question was for the model, what the paper calls the “difficulty of the prompt”.
So tokens per attempt can rise for two different reasons. The work may simply be more demanding, as with an agent running a loop. Or the extra thinking may buy a higher success rate. Either way, at a fixed effective price per token, the cost per successful task falls only if the success rate rises proportionally more than the tokens per attempt do, and that has to be measured.
What a buyer should compare
A buyer should compare routes on cost per successful task, not on price per token. The price per token is only one of the things that set that cost, and the others can move the opposite way.
Cost per successful task depends on three variables: the price per token, the tokens an attempt uses, and the success rate. Put them together in two steps. First, cost per successful task = effective price per token × tokens per successful task, where the effective price is averaged across input, output and cached tokens. Second, tokens per successful task = tokens per attempt ÷ success rate. If only half of attempts succeed, each success carries the tokens of two attempts. Combined, cost per successful task = price per token × tokens per attempt ÷ success rate. A falling token price pushes the first term down. Agents, reasoning and tool use can push the second term up. Better models push the third term up, which pushes cost down. Which effect wins is not a matter of principle. It has to be measured, one workload at a time.
That is why the Fable result should not be read as “the expensive model is always cheaper.” On Anthropic’s coding subset, the higher-priced model produced a lower bill per attempt and more passes. On a task where every model already succeeds, the cheaper meter could win. On a task where an agent loops for an hour, the token count could swamp any price cut. The unit stays the same in each case: a successful task. Which route is cheaper does not.
To compare the economics of two AI routes, fix a task and a test of success. Count everything billed per attempt, at the rates the buyer actually pays, including caching, batching and time of day. Divide by the success rate. State the speed and reliability required, what sits outside the bill, and the date. The result is a cost per successful task, and it is the only number in this list that refers to the product the buyer is paying for. The token price is an input to it. On a real coding workload, the token price pointed the wrong way.
That number has a capital consequence, because when it falls, someone keeps the difference.