



Inside China’s Machine · Tokenomics, Episode 4 of 10
The Answer Price = price per token × tokens per attempt ÷ success rate
This episode: tokens per attempt and success rate
On March 24, 2026, answering a question from China Central Television, Liu Liehong gave a number for China’s AI economy: “我国日均Token的调用量,也就是词元的调用量,已经超过了140万亿”. China’s average daily token calls, he said, have exceeded 140 trillion.
In the two years before, the price of a token had been falling. On September 19, 2024, Alibaba cut the real-time price of its qwen-plus model from 0.004 to 0.0008 yuan per thousand input tokens, and from 0.012 to 0.002 yuan per thousand output tokens. A year later, on September 29, 2025, DeepSeek announced new prices for its V3.2-Exp model that, in its words, “新价格即刻生效”, took effect immediately: input that hits the cache fell from 0.5 to 0.2 yuan per million tokens, input that misses it from 4 to 2, and output from 12 to 3.
Put the two facts side by side and a story writes itself. Tokens got cheaper, so people used more of them, so AI is being used more and costs less to use. That is the reading to test, as a hypothesis. It may be partly right. But neither of the two numbers can show it, because a token is a meter, and the meter can run faster for reasons that have nothing to do with more work or cheaper work.
The simplest case, again
Episode 1 set out the measure: the cost of a successful task is what an attempt costs divided by the success rate. For token charges alone, an attempt’s cost is the effective average price per token times the tokens the attempt uses.
Written that way, there are three terms: price, tokens per attempt and success rate. Price cuts move only the first. The second is mostly a choice. How much context to send, how long to let a model think, how many candidate answers to generate, how many tool calls to allow: each sets how many tokens one attempt consumes. The third depends on the model and the task.
Here is how the terms interact, in an illustration with chosen numbers rather than measured ones. Halve the price and leave everything else alone, and the cost of a successful task halves. Halve the price and double the tokens per attempt, and the cost is unchanged. Halve the price and triple the tokens, and the cost rises by half. Halve the price and triple the tokens, but also raise the success rate from 40 percent to 60 percent, and the cost is back where it started.
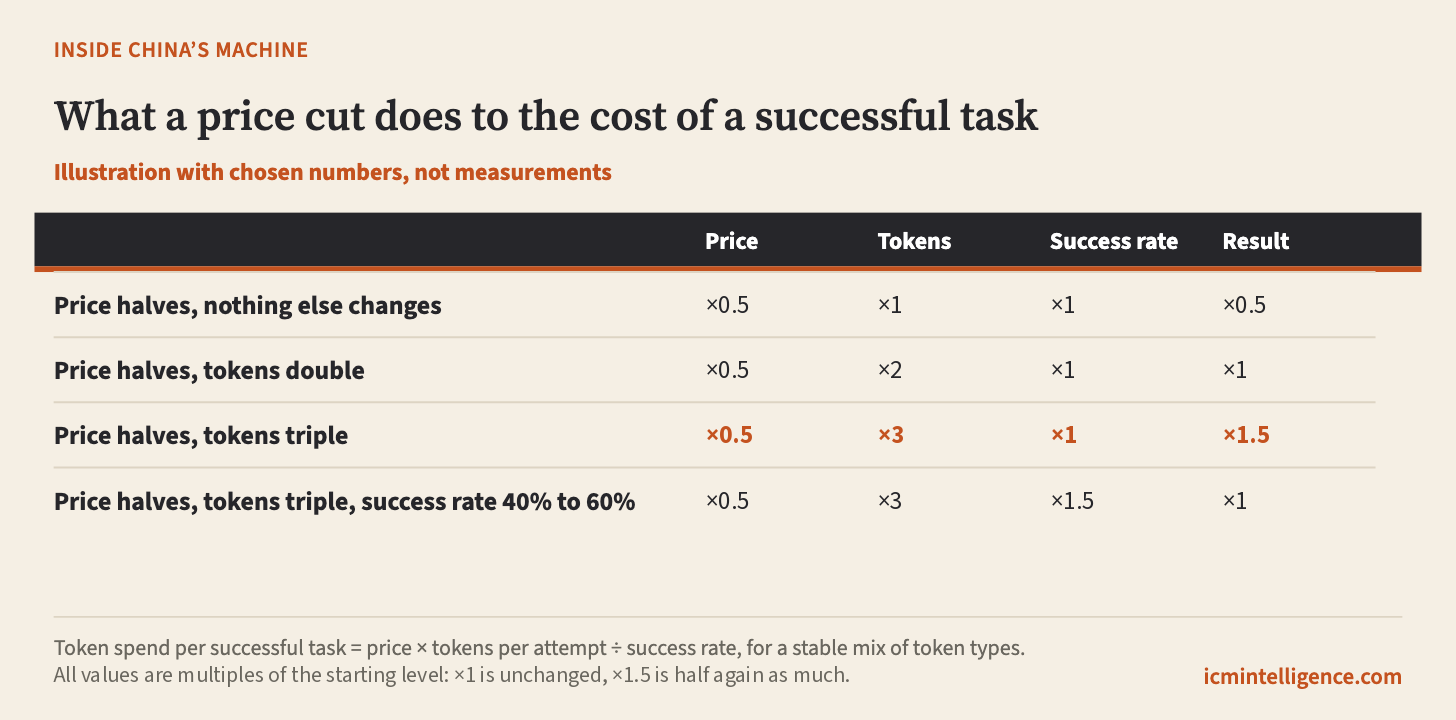
None of those cases is a forecast. They show that a price cut is one input among three, and that what happens to the cost of AI work depends on what people do with the cheaper tokens.
What more effort buys
The second term is where the evidence gets interesting, because researchers have measured what happens when a system is allowed to spend more.
Agentless is a published approach to fixing software issues automatically. Its authors ran it on SWE-bench Lite, a set of 300 software issues, using the gpt-4o-2024-05-13 model. In the full method, the system generates 42 candidate patches per issue, and its mean token use per issue was 42,376. The method has several dials: how many candidates, how they are chosen, whether the existing tests are used to filter them.
The paper’s Table 3 compares three ways of using the same model on the same 300 issues. They differ only in how a fix is produced and chosen. In the first, the model writes one candidate patch per issue, and that patch is submitted. In the second, the model writes many candidate patches per issue, and the one it produced most often is submitted, a majority vote. In the third, the model writes the same set of candidates, but any patch that breaks the repository’s existing tests is thrown out before the vote. The first solved 70 issues at a mean inference cost of $0.11 per issue. The second solved 78 at $0.34. The third solved 82, also at $0.34.
Spread the inference bill over the issues solved and the trade-off appears. The issue set is the same, the model is the same, and the success test is the same, so the comparison isolates the workflow choice. The arithmetic is total spend divided by issues solved, where total spend is 300 issues times the mean cost per issue. The single-sample version spent 300 × $0.11 = $33 to solve 70 issues, about $0.47 each. Majority voting spent 300 × $0.34 = $102 to solve 78, about $1.31 each. Test filtering spent the same $102 to solve 82, about $1.24 each. More effort solved eight to twelve more issues out of 300, and each success cost more in model spend: about 2.8 times as much with majority voting ($1.31 ÷ $0.47) and about 2.6 times as much with test filtering ($1.24 ÷ $0.47).
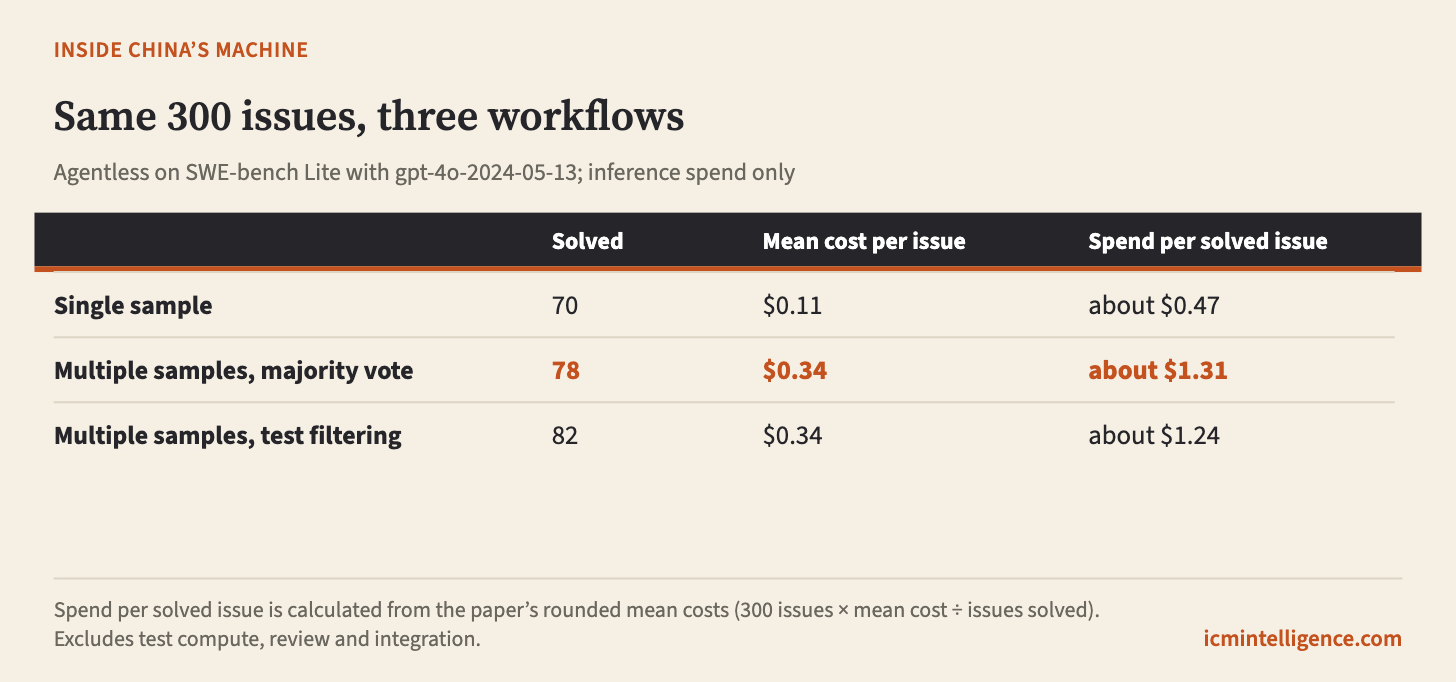
That is not an argument against the extra effort. If a solved issue is worth much more than a dollar, buying more of them at $1.24 can be a good trade. The point is that the extra tokens were a decision, not a side effect of a price, and they moved the cost of a success by more than a 50 percent price cut would, in the opposite direction.
The same pattern shows up in reasoning. The s1 study let a model think longer. On the AIME 2024 maths problems, accuracy rose “from 50% to 57%” as the thinking budget grew. The 57 percent is the last point on the paper’s own chart, the one with the largest thinking budget, and the chart puts it at 7,320 thinking tokens. Thinking tokens here are a research measure, not a commercial bill. Even so, spending more thinking bought more accuracy on this task.
Agents add a third pattern. An agent is not a different kind of model. It is an ordinary model run in a loop with tools: it chooses an action, such as looking up an order or issuing a refund, sees the result, and chooses the next action, until the task is done. Each step is a separate call to the model, so a single task can mean dozens of calls. The τ-bench study tested agents like this on simulated retail customer-service tasks, with a second model playing the customer. It capped each trial at “at most 30 agent actions” and reported that “the agent / user simulation costs are $0.38 / $0.23 per task respectively”. Of the agent’s cost, 95.9 percent came from input tokens and 4.1 percent from output. In these multi-step interactions, the bill was dominated by what the model read, not what it wrote. The reason is how an agent works. At every step, the model is sent the whole conversation so far: its instructions, the descriptions of its tools, and every earlier message and tool result. It replies with something short, usually one tool call or one message to the customer. Then the reply and the tool’s result are added to the conversation, and the whole thing is sent again for the next step. Over dozens of steps, the same context is read again and again, so input piles up much faster than output.
The same study also shows why the success rate, the third term, is harder to pin down for agents than for a model answering one question, such as an AIME maths problem, where the answer is checked once and is simply right or wrong. A run here means one complete attempt at a task: the whole conversation, with all its steps, from the customer’s first message to the end. The same agent given the same task can succeed on one run and fail on the next, so a single run does not tell you how often it will succeed. So the researchers run each task at least three times. Each run is a fresh conversation with the simulated customer. One success shows the agent can do the task. Repeated runs show whether it does it every time. The study reports a measure it calls pass^k: the chance that all k runs of a task succeed, not just one of them. Take two agents, one that succeeds on one run in three and one that succeeds on all three. If a task counts as solved when any of its runs succeeds, both agents get credit and look equally good. Pass^3 counts the task only when all three runs succeed, so only the second agent gets credit. For a business, pass^k is closer to what matters, because a customer-service agent that works two times in three still fails one customer in three. The study’s cost figures and its success figures come from separate parts of the paper, so the two cannot be combined into a measured cost per success here. What they show is that the bill and the success rate are reported under one fixed setup, a cap of “at most 30 agent actions” per task, so neither says what a different setup would cost or yield.
Intensity can also fall
It would be easy to conclude that tokens per task only ever rise. One developer report points the other way.
DeepSeek reported in its release of V3.1 that its thinking mode produced “输出 token 数减少 20%-50%”, 20 to 50 percent fewer output tokens. That is the developer’s own measurement of output tokens, on a different model with its own tokenizer, not an independent test of the same work, and a count of tokens is not a count of accepted work. But it reports lower output-token use, through model design rather than through price.
So the term in the middle can go either way. Price cuts lower the first term. Design choices by builders and buyers move the second, sometimes up and sometimes down. The cost of a successful task is whatever the three terms make it, and a price notice describes only one of them.
What a fair test would look like
If the question is whether cheaper tokens make agent work cheaper, the test has to hold everything but the price fixed. What that would take is worth setting out, and the list is itself instructive.
The same tasks, with their databases, policies and tools pinned so they cannot drift. The same prompts, tool definitions, context handling, temperature and reasoning settings on every route compared. A fixed limit on agent steps, and no silent retries: a failed transport call is recorded, not quietly repeated. The same success check, frozen before the run, so the definition of a solved task cannot change halfway through. A deadline set in advance. And a full record of cost: every token read and written, every cached token, every tool fee and every retry, kept separately for the agent, any simulated user and any checker, so nothing is counted twice and nothing is left out. Then total spend across all trials, successful or not, divided by the number that succeeded.
Each of those conditions exists because, without it, a price comparison can be quietly turned into a workflow comparison. Change the prompt, allow one more retry, loosen the success check, and the cost per success moves for reasons that have nothing to do with the price. The protocol is a proposal; it describes what any claim that price cuts lowered the cost of agent work would need behind it.
What the token count measures
Now return to 140 trillion.
A count of tokens is a count of metered model usage. It rises when more people use AI for more tasks. It also rises when the same tasks are done with longer contexts, more candidate answers, more thinking, more retries and more agent steps. The national figure does not say which of these is happening. Whether growth comes from new tasks or from heavier ways of doing existing ones is, on the public evidence, unresolved.
The same caution applies to company figures. Volcano Engine displays a figure of 120 trillion (”120万亿”) beside the label “日均token使用量”, average daily token use, for its Doubao models, on an event page whose numbers may have been updated after the event. Neither that figure nor the national one discloses how it is counted: which tokens, over what period, paid or internal, text or other kinds of data. The two cannot be divided into a market share, and neither measures completed work.
That matters because token volume is easily read as a demand curve: prices fell, volume rose, so demand responded to price. The data cannot support that reading. The price cuts and the national volume come from different products, periods and populations. Nothing in them shows that the cuts caused the growth, or how large any response was.
The old argument
The idea that cheaper use leads to more use is old. In 1865 William Stanley Jevons argued, about coal, that “new modes of economy will lead to an increase of consumption”. Make a resource more efficient to use, and people may use more of it in total.
That argument is a useful frame for AI, and only a frame. Whether cheaper AI work leads to more total spending is an empirical question about how much demand responds. The token figures are consistent with a large response, a small one, or one driven mostly by heavier ways of working rather than more work.